


NOTES (31-35) TO THE FINANCIAL STATEMENTS
| 31. | RELATED PARTY TRANSACTIONS (Rmillion) | |||||
| During the period Tongaat Hulett, in the ordinary course of business, entered into various related party sales, purchases and investment transactions. These transactions occurred under terms that are no less favourable than those arranged with third parties. Intra-group transactions are eliminated on consolidation. |
||||||
| Consolidated | Company | |||||
| 15 months to | 12 months to | 15 months to | 12 months to | |||
| 31 March | 31 December | 31 March | 31 December | |||
| 2010 | 2008 | 2010 | 2008 | |||
| Goods and services: | ||||||
| Transacted between operating entities within the company | 7 | 5 | ||||
| Between the company and its subsidiaries | 326 | 44 | ||||
| Transacted between subsidiaries within Tongaat Hulett | 335 | 117 | ||||
| Sales to external related parties | 2 | 138 | 138 | |||
| Tongaat-Hulett Pension Fund contribution cost | 65 | 30 | 57 | 27 | ||
| Administration fees and other income: | ||||||
| Transacted between operating entities within the company | 16 | 7 | ||||
| Between the company and its subsidiaries | 45 | 16 | ||||
| Transacted between subsidiaries within Tongaat Hulett | 132 | 57 | ||||
| Transacted with/between joint ventures within Tongaat Hulett | 7 | 1 | ||||
| Paid to external related parties | 4 | 3 | ||||
| Interest paid: | ||||||
| Transacted between operating entities within the company | 39 | 48 | ||||
| Between the company and its subsidiaries | 12 | 56 | ||||
| Transacted with/between joint ventures within Tongaat Hulett | 6 | 9 | ||||
| Interest received: | ||||||
| Transacted between operating entities within the company | 496 | 375 | ||||
| Between the company and its subsidiaries | 90 | 111 | ||||
| Transacted between subsidiaries within Tongaat Hulett | 48 | 47 | ||||
| Transacted with/between joint ventures within Tongaat Hulett | 3 | 5 | ||||
| Sales of fixed assets: | ||||||
| Between the company and its subsidiaries | 3 | 15 | ||||
| Loan balances: | ||||||
| Transacted between operating entities within the company | 4 305 | 3 257 | ||||
| Between the company and its subsidiaries | 962 | 649 | ||||
| Pension Fund Loan - Employer Surplus Account | 89 | 89 | ||||
| External related parties | 7 | 7 | ||||
| Dividends received: | ||||||
| Between the company and its subsidiaries | 137 | 329 | ||||
| Transacted between subsidiaries within Tongaat Hulett | 130 | 200 | ||||
| Other related party information: | ||||||
| Total dividends paid to the holding company and other shareholders - refer to note 24 | ||||||
| Directors - refer to notes 33 and 34 | ||||||
| Tongaat Hulett Developments is a guarantor on Tongaat Hulett Limited’s South African long-term unsecured loan facility. | ||||||
| 32. | RETIREMENT BENEFITS | |||||
|
Pension and Provident Fund Schemes
Tongaat Hulett contributes towards retirement benefits for substantially all permanent employees who, depending on preference or local legislation, are required to be a member of either a Tongaat Hulett implemented scheme or of various designated industry or state schemes. The Tongaat Hulett schemes are governed by the relevant retirement fund legislation. Their assets consist primarily of listed shares, fixed income securities, property investments and money market instruments and are held separately from those of Tongaat Hulett. The scheme assets are administered by boards of trustees, each of which includes elected employee representatives. Defined Benefit Pension Scheme The Tongaat-Hulett Pension Fund (the Fund) is a defined benefit scheme in South Africa and includes employees of Hulamin Limited. The Fund is actuarially valued at intervals of not more than three years using the projected unit credit method. In the statutory actuarial valuation of the scheme as at 31 December 2007 the Fund was certified by the reporting actuary to be in a sound financial position. With effect from 7 December 2001 the Pension Funds Second Amendment Act was promulgated. This Act required the Fund to submit a plan for the apportionment on a fair basis to the employer and past and current members of the Fund of the actuarial surplus as at 31 December 2001. The 2001 apportionment plan was approved by the Financial Services Board in May 2007. During 2008 and 2009/10 Tongaat Hulett became unconditionally entitled to its share of the 2001 employer surplus account and to its share of the 2007 surplus respectively and these amounts were recognised as an asset by Tongaat Hulett. The manner in which the Fund proceeds following the unbundling of Hulamin from Tongaat Hulett and the split between the employers participating in the Fund has yet to be finalised and/or become unconditional. Consequently, no further surplus apportionment has been recognised. An actuarial valuation of liabilities, based on the existing benefits, carried out as at 31 December 2009 in accordance with IAS 19 showed the present value of obligations to be adequately covered by the fair value of the scheme assets. |
||||||
| 31 December | 31 December | |||||
| 2009 | 2008 | |||||
| Rmillion | Rmillion | |||||
| Details of the valuation of the Fund (100%) are as follows: | ||||||
| Fair value of plan assets | ||||||
| Balance at 1 January 2009 | 5 537 | 6 544 | ||||
| Expected return on scheme assets | 395 | 520 | ||||
| Employer contributions | 87 | 52 | ||||
| Members’ contributions | 46 | 41 | ||||
| Benefits paid | (289) | (549) | ||||
| Net member transfers | (12) | (24) | ||||
| Actuarial gain/(loss) | 444 | (1 047) | ||||
| Balance at 31 December 2009 | 6 208 | 5 537 | ||||
| Present value of defined benefit obligation | ||||||
| Balance at 1 January 2009 | 4 455 | 4 444 | ||||
| Current service cost | 134 | 118 | ||||
| Interest cost | 319 | 350 | ||||
| Members’ contributions | 46 | 41 | ||||
| Benefits paid | (289) | (549) | ||||
| Net member transfers | (12) | (24) | ||||
| Actuarial loss | 109 | 75 | ||||
| Balance at 31 December 2009 | 4 762 | 4 455 | ||||
| Fund assets less member liabilities, before reserves | 1 446 | 1 082 | ||||
| Asset information | ||||||
| Equities | 3 812 | 3 542 | ||||
| Fixed interest bonds | 926 | 751 | ||||
| Property | 106 | 101 | ||||
| Cash | 1 364 | 1 143 | ||||
| 6 208 | 5 537 | |||||
| Included in the assets of the scheme are ordinary shares held in Tongaat Hulett Limited, stated at fair value | 148 | 95 | ||||
| Actual return on scheme assets | 839 | (527) | ||||
| The principal actuarial assumptions are: | ||||||
| Discount rate | 9,25% | 7,25% | ||||
| Salary cost and pension increase | 6,25% | 4,25% | ||||
| Expected rate of return on assets | 7,25% | 8,25% | ||||
| Experience gains and (losses) on: | ||||||
| Plan liabilities | (106) | (137) | ||||
| Percentage of the present value of the plan liabilities | 2,2% | 3,1% | ||||
| Plan assets | 444 | (1 047) | ||||
| Percentage of plan assets | 7,2% | (18,9%) | ||||
| Estimated contributions payable in the next financial year | 93 | 58 | ||||
|
Basis used to determine the rate of return on assets The expected rate of return on assets has been calculated using the discount rate at the beginning of the period, which corresponds to that used in the previous valuation. This is a reasonably conservative approach, adopted on the basis that the additional returns anticipated on certain other asset classes in which the Fund is invested (eg. equities) can only be achieved with increased risk. Defined Contribution Pension and Provident Schemes| The latest audited financial statements of the defined contribution schemes including the scheme located in Swaziland reflect a satisfactory state of affairs. Contributions of R27 million were expensed during the period (31 December 2008 - R22 million). Zimbabwe Pension Funds The Zimbabwe operations’ post-retirement provisions have been accounted for on consolidation, as reflected in note 27. The basis for determining the provisions has taken into account relevant assumptions which reflect the current situation in Zimbabwe, which is evolving. Post-Retirement Medical Aid Benefits In the South African operations, the obligation to pay medical aid contributions after retirement is no longer part of the conditions of employment for employees engaged after 30 June 1996. A number of pensioners and current employees remain entitled to this benefit. The entitlement to this benefit for current employees is dependent upon the employee remaining in service until retirement and completing a minimum service period of ten years. In Mozambique, Acucareira de Xinavane subsidises the medical contributions in respect of its pensioners. Included in the consolidated amounts for the current period are the post-retirement medical benefits for the Zimbabwe employees. The unfunded liability for post-retirement medical aid benefits is determined actuarially each year and comprises: |
||||||
| Consolidated | Company | |||||
| 15 months to | 12 months to | 15 months to | 12 months to | |||
| 31 March | 31 December | 31 March | 31 December | |||
| 2010 | 2008 | 2010 | 2008 | |||
| Rmillion | Rmillion | Rmillion | Rmillion | |||
| Amounts recognised in the statement of financial position: | ||||||
| Present value of unfunded obligations | 346 | 281 | 289 | 281 | ||
| Unrecognised actuarial losses | (42) | (58) | (53) | (58) | ||
| Net liability | 304 | 223 | 236 | 223 | ||
| The liability is reconciled as follows: | ||||||
| Net liability at beginning of period | 223 | 209 | 223 | 209 | ||
| Subsidiaries consolidated | 77 | |||||
| Currency alignment | (17) | 30 | 36 | |||
| Net expense recognised in income statement | 46 | (16) | (23) | 30 | ||
| Contributions | (25) | |||||
| Net liability at end of period | 304 | 223 | 236 | 223 | ||
| Amounts recognised in the income statement: | ||||||
| Service costs | 6 | 2 | 3 | 2 | ||
| Interest costs | 33 | 20 | 25 | 20 | ||
| Net actuarial losses recognised | 7 | 8 | 8 | 8 | ||
| 46 | 30 | 36 | 30 | |||
| The principal actuarial assumptions applied are: | ||||||
| Discount rate | ||||||
| South Africa | 9,00% | 7,25% | 9,00% | 7,25% | ||
| Mozambique | 11,0% | |||||
| Zimbabwe | 15,0% | |||||
| Health care cost inflation rate | ||||||
| South Africa | 6,50% | 5,00% | 6,50% | 5,00% | ||
| Mozambique | 8,0% | |||||
| Zimbabwe | 13,5% | |||||
| Sensitivity of healthcare cost trend rates: | ||||||
| 1% increase in trend rate - effect on the aggregate of the service and interest costs | 2 | 3 | 1 | 3 | ||
| 1% increase in trend rate - effect on the obligation | 41 | 33 | 33 | 33 | ||
| 1% decrease in trend rate - effect on the aggregate of the service and interest costs | 1 | 2 | 2 | |||
| 1% decrease in trend rate - effect on the obligation | 34 | 28 | 27 | 28 | ||
| Estimated contributions payable in the next financial year | 22 | 18 | 20 | 18 | ||
| Experience gains / (losses): | ||||||
| On plan liabilities | 3 | (22) | (9) | (22) | ||
| Percentage of the present value of the plan liabilities | 0,9% | (7,8%) | (3,1%) | (7,8%) | ||
Retirement Gratuities Tongaat Hulett has in the past made payments, on retirement, to eligible employees who have remained in service until retirement and have completed a minimum service period of ten years. The benefit is applicable to employees in the South African and Zimbabwean operations. The unfunded liability for retirement gratuities which is determined actuarially each year comprises: |
||||||
| Consolidated | Company | |||||
| 15 months to | 12 months to | 15 months to | 12 months to | |||
| 31 March | 31 December | 31 March | 31 December | |||
| 2010 | 2008 | 2010 | 2008 | |||
| Rmillion | Rmillion | Rmillion | Rmillion | |||
| Amounts recognised in the statement of financial position: | ||||||
| Present value of unfunded obligations | 155 | 67 | 71 | 67 | ||
| Unrecognised actuarial losses | (10) | (12) | (10) | (12) | ||
| Net liability | 145 | 55 | 61 | 55 | ||
| The liability is reconciled as follows: | ||||||
| Net liability at beginning of period | 55 | 51 | 55 | 51 | ||
| Subsidiaries consolidated | 105 | |||||
| Currency alignment | (23) | |||||
| Net expense recognised in income statement | 16 | 9 | 11 | 9 | ||
| Payments made | (8) | (5) | (5) | (5) | ||
| Net liability at end of period | 145 | 55 | 61 | 55 | ||
| Amounts recognised in the income statement: | ||||||
| Service costs | 7 | 3 | 4 | 3 | ||
| Interest costs | 7 | 5 | 6 | 5 | ||
| Net actuarial losses recognised | 2 | 1 | 1 | 1 | ||
| 16 | 9 | 11 | 9 | |||
| The principal actuarial assumptions applied are: | ||||||
| Discount rate | ||||||
| South Africa | 9,00% | 7,25% | 9,00% | 7,25% | ||
| Zimbabwe | 15,0% | |||||
| Salary inflation rate | ||||||
| South Africa | 6,50% | 5,00% | 6,50% | 5,00% | ||
| Zimbabwe | 12,5% | |||||
| Estimated contributions payable in the next financial year | 11 | 5 | 4 | 5 | ||
| Experience losses: | ||||||
| On plan liabilities | 2 | 9 | 2 | 9 | ||
| Percentage of the present value of the plan liabilities | 1,3% | 13,4% | 2,8% | 13,4% | ||
| 34. | EMPLOYEE SHARE INCENTIVE SCHEMES | |||||||||||||||||||||||||||||||||||||||||||||||||||||||||||||||||||||||||||||||||||||||||
| The adoption of IFRS 2 Share-based Payment (IFRS 2) in 2005 required that
all awards made after 7 November 2002 be accounted for in the financial
statements of the company. IFRS 2 has therefore been applied to The
Tongaat-Hulett Group Limited 2001 Share Option Scheme in respect of the
awards made on 14 April 2003, 1 October 2003 and 21 April 2004 and to the
new share incentive scheme comprising the Share Appreciation Right Scheme
2005 (SARS), the Long Term Incentive Plan 2005 (LTIP) and the Deferred Bonus
Plan 2005 (DBP).
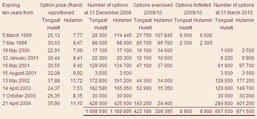
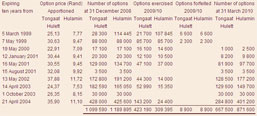
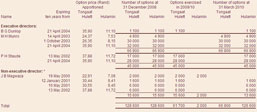
Details of awards in terms of the company’s share incentive schemes are as follows: As a result of the unbundling of Hulamin, participants in these share schemes who had not exercised their rights at the unbundling date converted their existing Tongaat-Hulett Group Limited instruments into two components, a Tongaat Hulett Limited component and a Hulamin Limited component, as detailed in the 2007 Annual Report. The obligation to settle these share schemes is in accordance with the following principles, which are in accordance with the Unbundling Agreement. Tongaat Hulett is obliged to settle all benefits under these share schemes for its own employees only, using Tongaat Hulett shares. It will settle the outstanding share scheme instruments that arise after the award adjustments for its own employees, by purchasing Tongaat Hulett shares in the market, or by issuing Tongaat Hulett shares. The benefit for the Hulamin component will be determined with reference to the Hulamin share price and the Tongaat Hulett component with respect to the Tongaat Hulett share price. Benefits arising from the Hulamin component will be settled using Tongaat Hulett shares. The Tongaat-Hulett Employees Share Incentive Scheme and The Tongaat-Hulett Group Limited 2001 Share Option Scheme (the Original Share Option Schemes) Under the original share option schemes participating employees were awarded share options in the company. On vesting the employee is entitled to purchase shares in the company and immediately sell the shares at the market price, thereby benefiting from the appreciation in the share price. The option price and number of unexercised options after the unbundling of Hulamin were apportioned into a Tongaat Hulett component (Tongaat Hulett) and a Hulamin component (Hulamin), as detailed in the 2007 Annual Report. The weighted average fair value costing of the combined Tongaat Hulett and Hulamin components of the outstanding share options granted in 2003 and 2004, determined using the binomial tree valuation model, was R11,14 per share and R16,06 per share respectively (31 December 2008 - R11,14 and R16,06). No awards have been made since 21 April 2004 under the original share option schemes, which were replaced by share schemes based on equity-settled share appreciation rights, conditional shares and a deferred annual bonus plan. The estimated fair value costing of these outstanding share appreciation rights was determined using the binomial tree valuation model and non-market performance conditions, based on the following significant inputs:
Share Appreciation Right Scheme 2005
The grant price and number of unexercised rights after the unbundling of Hulamin were apportioned into a Tongaat Hulett component and a Hulamin component, as detailed in the 2007 Annual Report. The estimated fair value costing of these outstanding share appreciation rights was determined using the binomial tree valuation model and non-market performance conditions, based on the following significant inputs:
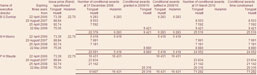
Long Term Incentive Plan 2005 Under the long term incentive plan, participating employees are granted conditional awards. These awards are converted into shares on the achievement of performance conditions over a performance period. The issue price and number of unexercised conditional awards after the unbundling of Hulamin were apportioned into a Tongaat Hulett component and a Hulamin component as detailed in the 2007 Annual Report. 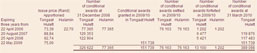 The estimated fair value costing of these outstanding conditional share awards was determined using the Monte Carlo Simulation model and non-market performance conditions, based on the following significant inputs:
Under the deferred bonus plan, participating employees purchase shares in the company with a portion of their after tax bonus. These pledged shares are held in trust by a third party administrator for a qualifying period, after which the company awards the employee a number of shares in the company which matches those pledged shares released from the trust. |
||||||||||||||||||||||||||||||||||||||||||||||||||||||||||||||||||||||||||||||||||||||||||
| Number of | Conditional | Conditional | Number of | |||||||||||||||||||||||||||||||||||||||||||||||||||||||||||||||||||||||||||||||||||||||
| conditional | awards | awards | conditional | |||||||||||||||||||||||||||||||||||||||||||||||||||||||||||||||||||||||||||||||||||||||
| Expiring | Issue price | awards at | granted in | settled in | awards at | |||||||||||||||||||||||||||||||||||||||||||||||||||||||||||||||||||||||||||||||||||||
| three years from | Rand | 31 Dec 2008 | 2009/10 | 2009/10 | 31 March 2010 | |||||||||||||||||||||||||||||||||||||||||||||||||||||||||||||||||||||||||||||||||||||
| 2 March 2007 | 90,27 | 21 537 | 21 537 | |||||||||||||||||||||||||||||||||||||||||||||||||||||||||||||||||||||||||||||||||||||||
| 1 March 2008 | 88,75 | 28 936 | 28 936 | |||||||||||||||||||||||||||||||||||||||||||||||||||||||||||||||||||||||||||||||||||||||
| 2 March 2009 | 74,72 | 46 586 | 46 586 | |||||||||||||||||||||||||||||||||||||||||||||||||||||||||||||||||||||||||||||||||||||||
| 3 March 2010 | 97,32 | 39 651 | 39 651 | |||||||||||||||||||||||||||||||||||||||||||||||||||||||||||||||||||||||||||||||||||||||
| 50 473 | 86 237 | 21 537 | 115 173 | |||||||||||||||||||||||||||||||||||||||||||||||||||||||||||||||||||||||||||||||||||||||
The estimated fair value costing of the outstanding deferred bonus share awards was based on the following significant inputs:
The deferred bonus shares were purchased by the participating employees on 2 March 2009 in respect of the 2009 award and on 3 March 2010 in respect of the 2010 award (2008 award: purchased 1 March 2008 and 2007 award: purchased 3 August 2007).
|
||||||||||||||||||||||||||||||||||||||||||||||||||||||||||||||||||||||||||||||||||||||||||

| 35. | BEE EMPLOYEE SHARE OWNERSHIP PLANS | |||||||||||||||||||||||||||||||||||||||||||||
|
The 7% BEE employee transaction comprises the Employee Share Ownership Plan (ESOP) and the Management Share Ownership Plan (MSOP).
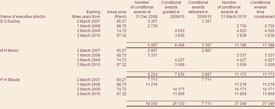
The ESOP scheme consists of a share appreciation right scheme and participants share in 50% of the dividend payable to ordinary shareholders. The MSOP scheme consists of two components, namely a share appreciation right scheme and a share grant scheme. The ESOP Trust and MSOP Trust were established to acquire and hold Tongaat Hulett Limited shares for the benefit of designated employees. Tongaat Hulett Limited and its subsidiaries have made contributions to the MSOP Trust and the ESOP Trust (refer to note 3). Due to these shares having specific repurchase rights at maturity (five years from grant date), they are a separate class of restricted shares which, other than for the repurchase terms, rank paripassu with ordinary shares and become ordinary shares on repurchase. The number of shares repurchased at maturity is calculated such that the market value of the repurchased shares will be equal to :
Under the share appreciation right scheme, participating employees are awarded the right to receive shares equal in value to the difference between the exercise price which will be equal to the grant price plus the aggregate of all cash dividends received (in the instance of the ESOP) and the market value at maturity of the scheme. The employees therefore participate in the share price appreciation in Tongaat Hulett. Under the share grant scheme, participating employees were granted the right to obtain ordinary shares in Tongaat Hulett on vesting. The value of both the MSOP share appreciation scheme and the MSOP share grant scheme are capped at a level of 10% compounded growth per year.
|
||||||||||||||||||||||||||||||||||||||||||||||
| Grant date |
Estimated fair value per right Rand |
Number of shares issued at 31 March 2010 |
Number of rights allocated at 31 December 2008 |
Number of rights allocated in 2009/10 |
Number of rights forfeited in 2009/10 |
Number of rights allocated at 31 March 2010 |
||||||||||||||||||||||||||||||||||||||||
| 1 August 2007 | 28,90 | 5 422 829 | 3 913 575 | 363 620 | 3 549 955 | |||||||||||||||||||||||||||||||||||||||||
| 1 February 2008 | 18,38 | 181 740 | 17 020 | 164 720 | ||||||||||||||||||||||||||||||||||||||||||
| 1 August 2008 | 17,92 | 208 350 | 11 000 | 197 350 | ||||||||||||||||||||||||||||||||||||||||||
| 1 February 2009 | 13,44 | 167 640 | 10 840 | 156 800 | ||||||||||||||||||||||||||||||||||||||||||
| 1 August 2009 | 26,88 | 115 475 | 4 820 | 110 655 | ||||||||||||||||||||||||||||||||||||||||||
| 1 February 2010 | 24,67 | 115 270 | 115 270 | |||||||||||||||||||||||||||||||||||||||||||
| 5 422 829 | 4 303 665 | 398 385 | 407 300 | 4 294 750 | ||||||||||||||||||||||||||||||||||||||||||
Management Share Ownership Plan - Share Appreciation Right Scheme |
||||||||||||||||||||||||||||||||||||||||||||||
| Grant date |
Estimated fair value per right Rand |
Number of shares issued at 31 March 2010 |
Number of rights allocated at 31 December 2008 |
Number of rights allocated in 2009/10 |
Number of rights forfeited in 2009/10 |
Number of rights allocated at 31 March 2010 |
||||||||||||||||||||||||||||||||||||||||
| 1 August 2007 | 19,80 | 3 296 657 | 1 453 580 | 98 730 | 1 354 850 | |||||||||||||||||||||||||||||||||||||||||
| 1 February 2008 | 13,93 | 167 710 | 4 170 | 163 540 | ||||||||||||||||||||||||||||||||||||||||||
| 1 August 2008 | 14,79 | 176 460 | 9 740 | 166 720 | ||||||||||||||||||||||||||||||||||||||||||
| 1 February 2009 | 10,56 | 96 110 | 14 250 | 81 860 | ||||||||||||||||||||||||||||||||||||||||||
| 1 August 2009 | 24,83 | 72 920 | 4 540 | 68 380 | ||||||||||||||||||||||||||||||||||||||||||
| 1 February 2010 | 25,14 | 108 470 | 108 470 | |||||||||||||||||||||||||||||||||||||||||||
| 3 296 657 | 1 797 750 | 277 500 | 131 430 | 1 943 820 | ||||||||||||||||||||||||||||||||||||||||||
Management Share Ownership Plan - Share Grant Scheme |
||||||||||||||||||||||||||||||||||||||||||||||
| Grant date |
Estimated fair value per right Rand |
Number of shares issued at 31 March 2010 |
Number of rights allocated at 31 December 2008 |
Number of rights allocated in 2009/10 |
Number of rights forfeited in 2009/10 |
Number of rights allocated at 31 March 2010 |
||||||||||||||||||||||||||||||||||||||||
| 1 August 2007 | 64,00 | 1 021 422 | 450 070 | 30 570 | 419 500 | |||||||||||||||||||||||||||||||||||||||||
| 1 February 2008 | 54,37 | 51 950 | 1 290 | 50 660 | ||||||||||||||||||||||||||||||||||||||||||
| 1 August 2008 | 57,39 | 54 620 | 3 010 | 51 610 | ||||||||||||||||||||||||||||||||||||||||||
| 1 February 2009 | 52,47 | 29 740 | 4 420 | 25 320 | ||||||||||||||||||||||||||||||||||||||||||
| 1 August 2009 | 79,10 | 22 560 | 1 400 | 21 160 | ||||||||||||||||||||||||||||||||||||||||||
| 1 February 2010 | 82,61 | 33 580 | 33 580 | |||||||||||||||||||||||||||||||||||||||||||
| 1 021 422 | 556 640 | 85 880 | 40 690 | 601 830 | ||||||||||||||||||||||||||||||||||||||||||
The estimated fair value costing of these share appreciation rights and share grant rights was determined using option pricing methodology, based on the following significant inputs:
|
||||||||||||||||||||||||||||||||||||||||||||||

